World Development Indicators Analysis (2022)
2025-10-06
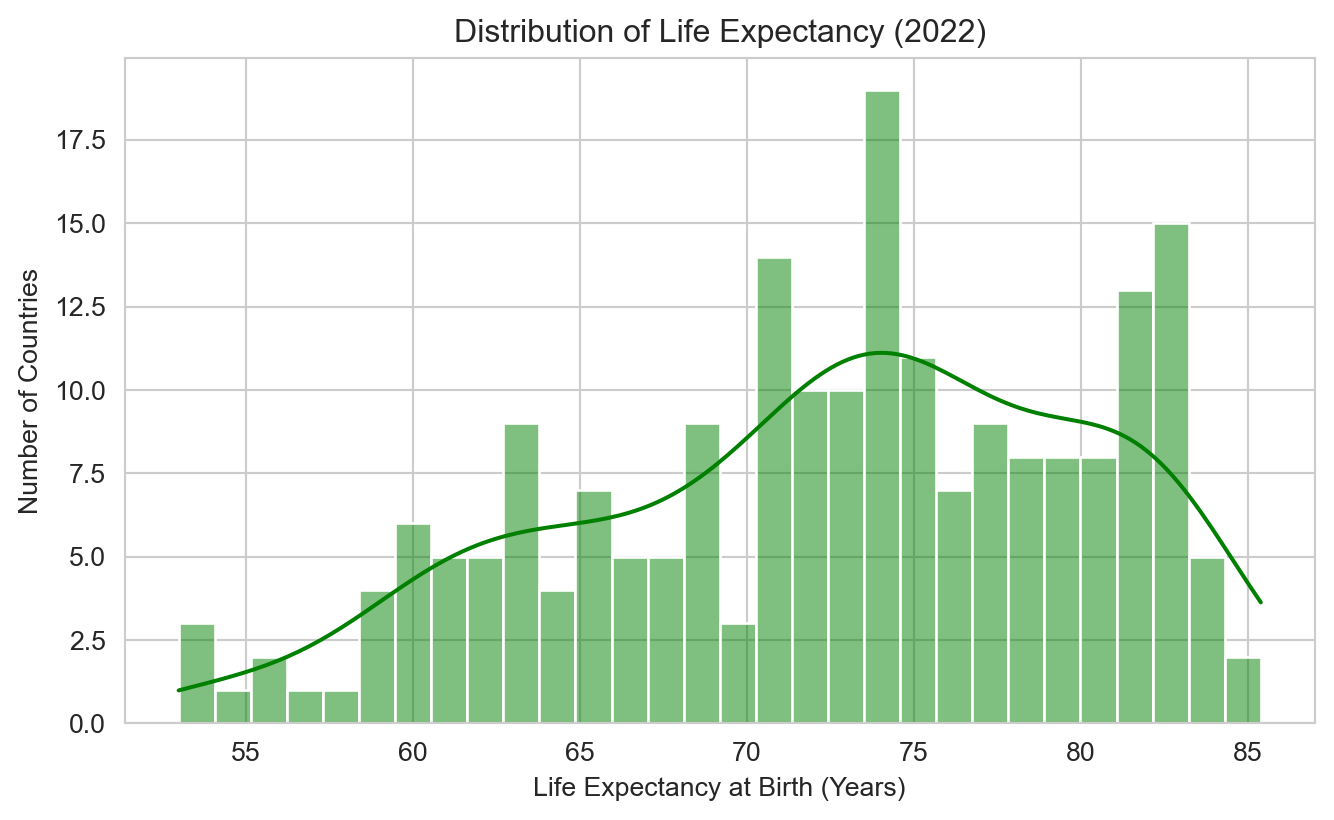
Life Expectancy Analysis
We see that the mean life expectancy of the countries is 72.42, the median is 73.51, and the standard deviation is 7.71. We see a longer and thiner tail of life expectancies on the lower end, and a shorter and thicker tail of life expectancies on the high end.
Inflation Analysis
We see that the mean inflation rate is 12.49 percent, the median is 7.97 percent, and the standard deviation is 19.68 percent. We see a vaguely normal distribution. Most of the data points are clustered between 0 and 20 percent annual inflation, with a few outliers on the right tail.

GDP Per Capita Analysis
We see that the mean GDP per capita of the countries is $20,345.71, the median is $7,587.59, and standard deviation is $31,308.94. We observe that the GDP per capita of the countries in the data set follow a power law distributions.
